How does it work?
ICONVIS back-end, developed in JAVA EE, aims on the one hand to extract information from the ontology and on the other hand to interface with a chosen data source. This component takes as input two files: an ontology expressed in RDF/OWL and an XML configuration file in which system administrator defines specific queries (for classes or instances) in order to retrieve information from the data source. ICONVIS back-end exposes a number of methods via Web services for ICONVIS front-end component.
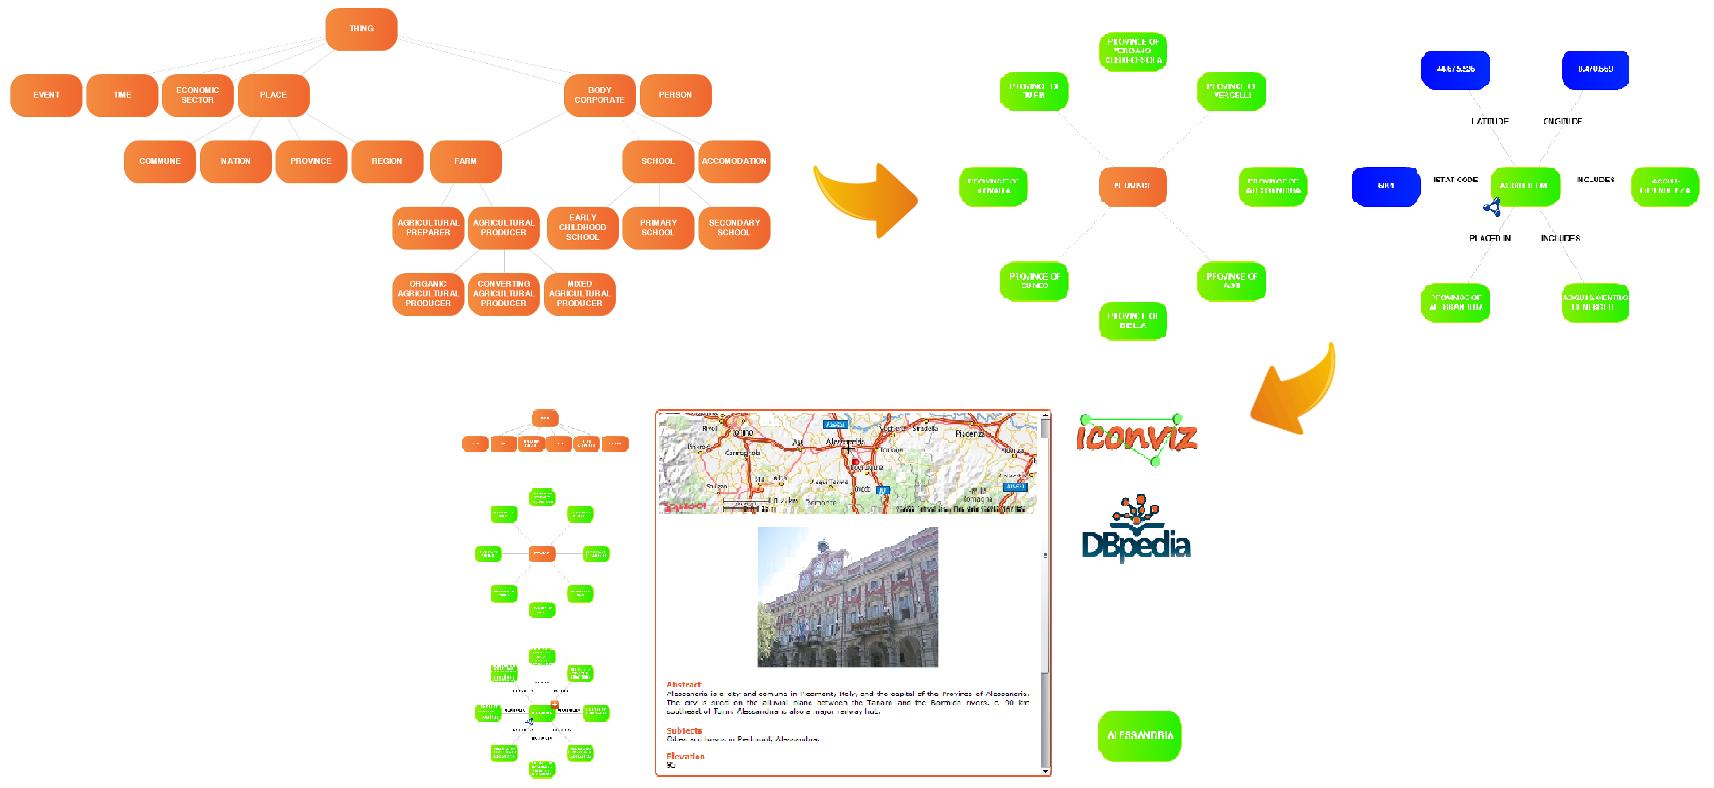
ICONVIS font-end is a Flex application designed with the intention of representing graphically the ontology graph, its object properties ad its data properties and allowing users both to explore and query the data source. This component uses Flare library for the graphics and some external services (DBpedia and Geonames SPARQL endpoints, Yahoo! Maps) to access further information on the Web.

What is it for?
Digitization process has led to the proliferation of a large amount of information, which is more and more complex to manage or exploit. In this context ontologies are an useful mean to restore order, because they describe a collection of concepts related to each other within a specific domain of knowledge. In addition to providing valuable support to semantic search algorithms, ontologies in many cases are represented visually: they become the visual tool through which users can pinpoint information they are interested in, browsing concepts linked by different relations.
So ICONVIS is particularly suitable for content publishers who want to offer their customers a different and educational utilization of their large data repository. Thanks to its level of configurability, ICONVIS can be adapted to several different domain (such as e-commerce, cultural heritage, online publishing, government and so on) starting from specific settings for managing database and ontology.
Can I try it?
Sure, just visit our Demo page to run a live ICONVIS demo based on dati.piemonte.it datasets, or download and install locally the application from the Download section.
